Running head: Computer-driven RNA Fingerprinting
Keywords: Genetics, Computer Simulation, Sequence Analysis, Differential
Display, RNA Fingerprinting
Computer simulations of RNA fingerprinting PCR experiments were run on custom made human and murine nonredundant (nr) nucleotide databases generated as described in the Systems and Methods section.
Simulations in a human database - In a first series of
simulations (MAN12.8) 10,000 12-character strings were generated at random,
to represent dodecanucleotide primers, with the initial requirement that
they contain 8 C's or G's and 4 A's or T's, reflecting higher C and G contents
in coding regions than in 3' untranslated regions. Primers containing either
stop codons (TAA, TAG, TGA) in the sense strand or ³ 4 homonucleotide
stretches (AAAA, CCCC etc.) were discarded (criteria a and b, respectively).
Also discarded were primers with palindromic 5' and 3' ends, ³ 4 successive
complementary bases long (criterion c). The above criteria were aimed at
biasing the primers towards the coding sequences (CDS, a), and at enhancing
the efficiency of PCR experiments (b and c).
The first 1,000 primers considered acceptable according
to criteria a, b, and c, were challenged against the human nr database
(2,085-sequences, 4.4 Mb total DNA, 72.8% CDS, see Materials and Methods),
to simulate the PCR. Primers yielding >100 but <250 simulated PCR products
were considered adequate (114 primers); 345 primers were labeled as inefficient
and 44 as "too efficient" (primers yielding an excessive number of products
might target repetitive or low complexity templates, and result in low
amplification efficiencies in the experimental phase); 497 primers were
excluded because they contained >5 out of 8 bases at the 3' end identical
to a previously accepted primer (criterion d). This criterion was aimed
at reducing the chance of repeatedly targeting the same sequences.
Figure 1A illustrates a histogram
of simulated PCR product numbers obtained with the series of 503 accepted
primers based on criteria a-d. Also illustrated is the probability density
function (%) computed for the same set of primers against a randomly scrambled
sequence database (see the Appendix for details
on the computation of this curve). The observed distribution is nonrandom,
featuring markedly overcrowded shoulders. This indicates the existence
of significant numbers of particularly inefficient primers, as well as
of particularly efficient ones, and points to the possibility of selecting
a panel of valuable PCR primers based on the present "simulated gene fishing"
approach.
Simulations in a mouse database - The same panel of 1000 primers, generated
for simulations in the human database, was tested on the mouse nr nucleotide
database (MOUSE 12.8), containing 1041 sequences comprised of 2.95 Mb total
nucleotide sequence, (72.5% CDS), in order to check whether species-specific
features in sequence composition played a major role in determining the
efficiency scores of different primers. In this case, 193 "good" primers
and 326 inefficient or too efficient ones were obtained; 481 primers were
excluded due to criterion d. The distribution of simulated PCR product
numbers per primer was qualitatively similar to the one obtained in the
human database. Figure 1B is a scatter plot of the
number of simulated PCR products obtained in the human (x-axis) vs. the
mouse (y-axis) database, with the same primers. The two sets of values
correlate very well (correl. coeff. r = 0.947).
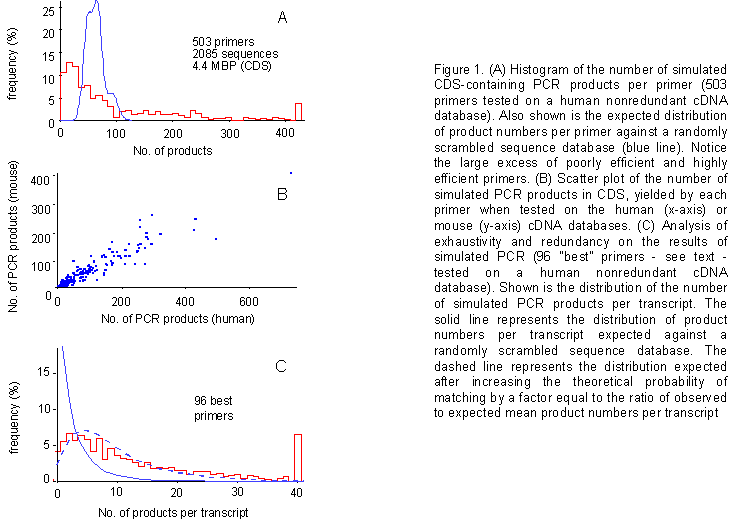
Degree of coverage of the primer panel - Next, we set out to address the issue of exhaustivity of a panel comprised of the 96 best primers. It may be argued that the primers selected because of their high efficiency in yielding simulated PCR products may be directed towards subpopulations of genetic sequences within the expressed sequence database. If this were the case, the number of transcripts not targeted by any primer (failures) should be higher than expected based on the mean number of simulated products per transcript. Figure 1C describes a simulation run on the human nr database and illustrates that this is not the case. In particular, it shows the number of primers targeting each transcript. The 96 most efficient primers yield more products in the actual transcribed sequence database than it can be calculated for a randomly scrambled transcribed sequence database. When such increase in efficiency is taken into account, theoretical distributions (dashed lines in figure 1C) fit the results of the simulations, arguing against a bias of our primer panel towards specific subpopulations of target sequences. Basically, our data speak for the existence of good and bad primers (nonrandom distribution), but fail to reveal the existence of unexpectedly good or bad templates (random distribution).
Effect of base composition of the primers - The choice of primers rich in C's and G's was driven by the goal of targeting coding regions. However, it became necessary to ascertain whether this unbalanced base composition in the primers could determine a bias in the choice of target sequences from the database. To address this issue, the same simulations described above were performed using 12-nucleotide primers composed of 6 A's or T's and 6 C's or G's (MAN12.6, MOUSE12.6). As far as coverage, the results were superimposable to those obtained with the CG-rich primer set (not shown).
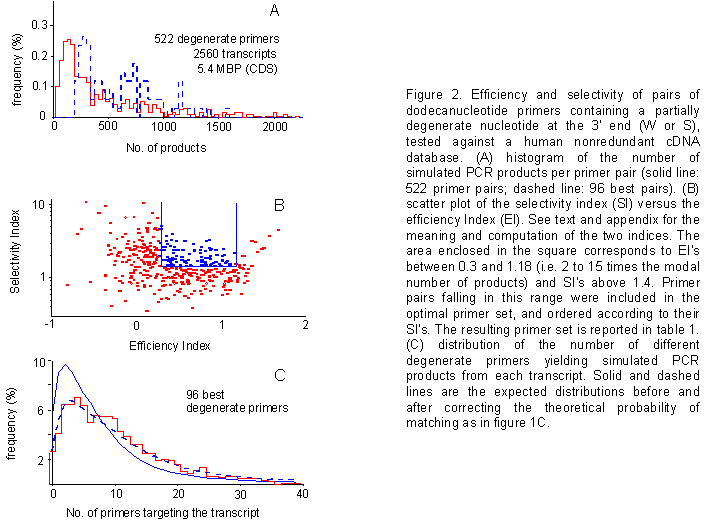
Use of degenerate primers - We reasoned that the introduction of a partially degenerate position at the 3' end of each primer would lead to an increase in product numbers, and enhance the exhaustivity of our optimal primer collection. Thus, we went back and repeated computer simulations using 12-nucleotide CG-rich primers, containing a partially degenerate base (W or S) at their 3' ends (representing primer pairs, rather than single primers). As expected, the use of degenerate primers in simulations gave rise to an increased product number, with respect to nondegenerate ones (figure 2A).
| ID. | sequence | S.I. | E.I. | ID. | sequence | S.I. | E.I. | ID. | sequence | S.I. | E.I. | ||
| 942 | ACGCCATCGACC/G | 6.39 | 1.84 | 280 | GCCGGGAACTTC/G | 2.34 | 5.9 | 192 | AGCCGGAGGATG/C | 1.81 | 7.5 | ||
| 688 | AAGCTGCTCGCG/C | 4.99 | 2.07 | 103 | ATCCTGCACCGC/G | 2.33 | 3.28 | 745 | AGAGTGCGCTCG/C | 1.79 | 2.77 | ||
| 522 | GGCACATTGCGG/C | 4.5 | 1.96 | 529 | AGGTACCCGTGC/G | 2.31 | 4.98 | 112 | CCTGCCGGAAGA/T | 1.79 | 6.94 | ||
| 567 | CCAGATGCCCGA/T | 4.44 | 2.06 | 445 | TGTTGTGGCGGC/G | 2.3 | 3.01 | 952 | CAGGCCACATCG/C | 1.76 | 2.74 | ||
| 328 | GCAGCATCCGGA/T | 3.86 | 2.75 | 701 | CGGCTATCGGCT/A | 2.28 | 2.2 | 791 | TCCTGCGGATCG/C | 1.76 | 2.98 | ||
| 60 | CGATCACAGCGG/C | 3.63 | 2.28 | 302 | GCGGACCTCATG/C | 2.27 | 7.68 | 164 | CAGGTCACGGAG/C | 1.74 | 7.74 | ||
| 95 | TCGATGCCGCTG/C | 3.35 | 8.03 | 212 | CTCTCCGATGCC/G | 2.26 | 3.7 | 918 | CCGGAAAGCACG/C | 1.74 | 2.51 | ||
| 417 | ATGGCAACGGCG/C | 3.32 | 5.77 | 237 | CCGGGTCCTCAT/A | 2.24 | 6.79 | 108 | CTTGGTCGTGCC/G | 1.72 | 2.71 | ||
| 2 | TCTGGGAACCGG/C | 3.19 | 2.65 | 115 | GGCGCCTACTTC/G | 2.23 | 5.09 | 292 | CGTGCAGTTCCC/G | 1.71 | 3.55 | ||
| 187 | TGCTGCAGGACC/G | 3.17 | 7.61 | 674 | CGGCTTTCGTGC/G | 2.16 | 2.22 | 372 | TCTCCGCGGTCA/T | 1.71 | 4.27 | ||
| 88 | CGTGGGCAACCT/A | 3.13 | 6.9 | 20 | ATGCCCAAGCGC/G | 2.13 | 2.11 | 799 | AGACCGTGGACG/C | 1.7 | 2.33 | ||
| 814 | GAGCTTCACCGC/G | 3.13 | 2.32 | 470 | CAGCAAGTCGGC/G | 2.09 | 2.81 | 366 | GAGGAACCGGAC/G | 1.68 | 10.69 | ||
| 780 | GAGGCGACGATC/G | 3.1 | 3.92 | 176 | AAGCCGACCTCC/G | 2.08 | 5.79 | 286 | GACCACCGTGTG/C | 1.68 | 6.21 | ||
| 402 | TCGTCGACGGTG/C | 3.08 | 1.89 | 156 | GCGCATCCAGCT/A | 2.08 | 14.82 | 355 | CCAGCGTGTTCC/G | 1.68 | 2.12 | ||
| 282 | ACAGGCGATGCC/G | 3.08 | 3.06 | 109 | GGCATTCCGCAC/G | 2.04 | 4.32 | 910 | CACCTACCGAGC/G | 1.66 | 2.57 | ||
| 648 | AGAGCAGGGCGA/T | 2.93 | 2.01 | 320 | GCACCGACTGGT/A | 2.02 | 9.16 | 418 | CCAACGAGTCCC/G | 1.65 | 2.45 | ||
| 91 | CTTCTCCCGGTC/G | 2.8 | 4.82 | 137 | ACCAAGCCCACC/G | 1.99 | 11.2 | 114 | CTGGTCACGTGC/G | 1.64 | 3.88 | ||
| 685 | TGTGGAGCCGGT/A | 2.79 | 2.38 | 138 | CCTGTCCGTCCT/A | 1.93 | 18.49 | 224 | CCCGTCTACCAC/G | 1.63 | 12.37 | ||
| 151 | CGGCACATCTCC/G | 2.68 | 4.95 | 230 | GGTCCCAATGGG/C | 1.93 | 10.68 | 313 | GCCCTTCGTCAG/C | 1.63 | 5.53 | ||
| 333 | GGCCGCATTGGA/T | 2.66 | 6.48 | 357 | GTCCTGCGGGTT/A | 1.92 | 1.91 | 149 | CACAACCGGCAG/C | 1.63 | 10.82 | ||
| 97 | GCAGAAGCCGTG/C | 2.64 | 2.6 | 423 | AGCGGAGCATCC/G | 1.92 | 1.91 | 453 | GTGCCACGCATC/G | 1.62 | 2.6 | ||
| 29 | CGGTCATGGTCG/C | 2.58 | 2.26 | 283 | AGCTCTGCGAGC/G | 1.91 | 7.73 | 119 | GCTCGATCAGGC/G | 1.6 | 6.3 | ||
| 309 | GGCCGAAGACCA/T | 2.57 | 5.91 | 23 | CCGCATGTCCAC/G | 1.9 | 19.46 | 542 | AGGACGCGCATC/G | 1.6 | 3.12 | ||
| 850 | CCAGCACTTCGC/G | 2.54 | 2.17 | 560 | CGCCCTGGAACT/A | 1.9 | 3.07 | 580 | TGGCCAACTGCG/C | 1.59 | 3.93 | ||
| 468 | AGCCATTCGGGC/G | 2.53 | 2.86 | 868 | GTCGCCGGCAAT/A | 1.89 | 1.83 | 185 | TCGTCACCAGCC/G | 1.59 | 6.81 | ||
| 80 | GTGTTGGTGCCC/G | 2.47 | 7.53 | 755 | GCTGCCGCCAAT/A | 1.88 | 3.52 | 463 | GTGGACGGTGCA/T | 1.59 | 6.2 | ||
| 180 | TGGACGTTGGCC/G | 2.42 | 8.05 | 219 | CGCTGTCGAGGA/T | 1.87 | 5.99 | 132 | TCGTGGCTGCAG/C | 1.58 | 12.19 | ||
| 24 | GGAGAAGCTGCC/G | 2.39 | 10.91 | 595 | AGGGCTTTCGGC/G | 1.87 | 2.34 | 290 | GCCTCCTGGAGT/A | 1.56 | 9 | ||
| 824 | AGGCGGACATCG/C | 2.35 | 2.82 | 130 | GGTGCTCAGCAG/C | 1.85 | 15.4 | 56 | TGGCTGGGATGG/C | 1.54 | 8.4 | ||
| 195 | AGCAGCTCGTGG/C | 2.35 | 8.91 | 96 | CCTTGGAAGCCC/G | 1.82 | 8.35 | 332 | GCGGATGCGGAA/T | 1.53 | 4.02 | ||
| 52 | CAATACGGGCCC/G | 2.35 | 1.97 | 507 | GCGGTCGAAGAC/G | 1.82 | 4.33 | 163 | ACGTGCCCAGCA/T | 1.53 | 11.55 | ||
| 511 | ACAAGGGCACGG/C | 2.35 | 1.87 | 324 | TCTGCCGGGTCT/A | 1.82 | 6.8 | 51 | TGCCGACTCTGC/G | 1.51 | 15.7 |
As a result of the elaboration described above, 25 primers were synthesized and tested at the bench (12 nondegenerate, 13 degenerate), to assess the correspondence between theoretical predictions and experimental results. As templates, we used total RNA from HepG2 cells cultured in different redox conditions (Cabibbo et al., in preparation), and from embryonic and postnatal mouse brain territories (Corradi et al., in preparation; Alli et al., in progress).
Setup of optimal amplification conditions - The optimal annealing temperature for our primer panel was determined by testing different annealing temperatures in a range between 45 °C and 53 °C. The best results were obtained at 50 °C. Lower temperatures caused weaker, fuzzier banding patterns, whereas no bands were seen with 52 or 53 °C in the annealing step. The optimal number of degenerate nucleotides was also determined experimentally, by testing primers containing no degenerate position, one degenerate position at the 3' end nucleotide, or two degenerate positions at nt 11 and 12. The best and most reproducible results were repeatedly obtained with one site of partial degeneration (W or S) at nt 12, or the 3' terminal nucleotide.
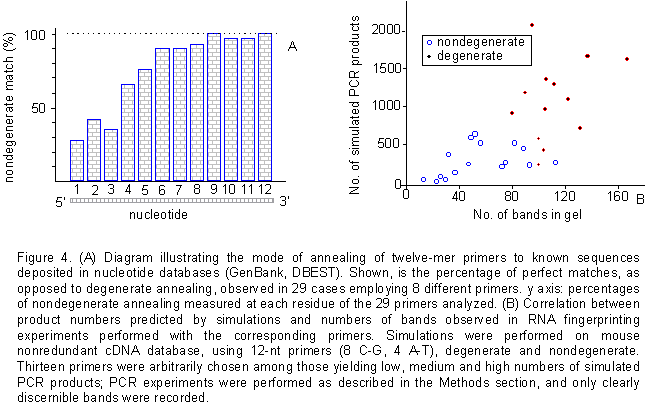
Annealing of the primers to the target sequences - As
a further step, we analyzed the mode of annealing in our experimental conditions
with respect to the annealing constraints set in our simulations. Clones
obtained by RNA fingerprinting were sequenced and aligned to nucleotide
databases. Products identical to deposited cDNAs or ESTs were analyzed
to determine where exactly in the transcript the primer had annealed, with
how many mismatches, and where the mismatches had occurred in the primer
sequence. As shown in figure 4A, the experimental annealing
conditions represent an excellent approximation of the simulated ones.
In only two cases out of twenty nine did a mismatch occur at any site within
the last four bases at the 3' end of the oligonucleotide. As it turns out,
in all other cases the last four bases of the primer and template matched
perfectly, defining a 3' four-base stretch critical for annealing and elongation
when using a 12mer in our PCR conditions. Throughout the remaining length
of the primer, annealing could occur even in the presence of up to four
mismatches.
Selectivity of primer panel for coding sequences - Thirty three "differentially displayed" bands obtained by RT-PCR with each of nine different twelvemers were cloned and sequenced, 29 of which displayed ORFs throughout their lengths. Of these, 20 represented known coding sequences or their homospecific/cross-specific homologues; 9 additional new ORFs were analyzed with the GRAIL program (Roberts, 1991), which predicted an excellent coding probability in 6 out of nine cases. The relatively low number of cloned and sequenced products makes it impossible to correlate expected and observed ratios of coding to noncoding cDNAs and, in fact, the ratio of coding to noncoding cDNAs reflects that of translated to untranslated RNA sequence in mammalians. However, it may certainly be inferred from these preliminary results that the internal primer panel described here enhances access to coding regions by two orders of magnitude when compared to the differential display approach.
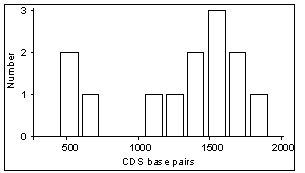
Size of amplified cDNAs - Because the described amplification
strategy is based on the occurrence of two copies (one sense and one antisense)
of a degenerate 12-mer within a single mature transcript, we set out to
determine whether our approach would lead to the preferential amplification
of large size cDNAs, corresponding to large transcripts. Table
2 describes the sizes of transcripts and open reading frames from 13
published cDNAs identified through our approach. These transcripts range
in size between 1.0 and 3.8 kb. The corresponding open reading frames range
in size between 582 and 1914 nt. These preliminary figures suggest that
small transcripts are amplified as efficiently as larger ones, likely due
to (i) high levels of degeneracy in the primer annealing step, and (ii)
high-frequency occurrence of specific sequence motifs in coding regions.
|
|
|
|
|
|
|
|
|
|
|
|
|
|
|
|
|
|
|
|
|
|
|
|
|
|
|
|
|
|
|
|
|
|
|
|
|
|
|
|
|
|
|
|
|
|
|
|
|
|
|
|
|
|
|
|
|
|
|
|
|
|
|
|
|
|
|
|
|
|
The basic idea of computer assisted gene fishing,
illustrated here, is to select, among random-sequence PCR primers, the
most efficient and selective ones, as judged from the results of computer
simulations of PCR procedures on nonredundant cDNA sequence databases.
The simulation approach represents a forceful oversimplification of experimental
conditions and is governed by rigid rules: in the case described here,
hybridization was assumed to occur whenever a perfect 4-base match at the
3' end of the primer occurred, with no more than 3 mismatches in the remaining
portion, and a relevant PCR product was assumed to occur whenever a pairing
occurred on the sense strand and a second pairing occurred on the antisense
strand, 100-1000 bp downstream. These assumptions overlook the occurrence
of (a) highly degenerate annealing on particularly abundant mRNA species,
which can yield detectable bands in PCR gels; (b) hairpins generating gaps
in primer-template doublets; (c) limiting PCR reagent concentrations which
may disfavor mRNA species present at low copy numbers. Still, the results
reported here support the value of simulation as a rational approach to
designing efficient and selective primers for RNA fingerprinting.
The notion of employing 12-bp PCR primers selected
according to criteria other than pure chance is supported by several lines
of evidence. Experimentally, large differences are observed in the number
of PCR products generated from the same cDNAs by "high efficiency" versus
"low efficiency" primers. It is well known that the frequency of occurrence
of nucleotide "words" of a given length varies widely among different types
of DNA sequences (introns, coding regions, etc.) (Claverie, Sauvaget and
Bougueleret, 1990). This suggests that specific 12-nt sequences, when used
as PCR primers, may be endowed with widely different efficiencies and possibly
selectivities for coding vs. non-coding regions. Indeed, all simulations
indicate that the distributions of the number of simulated PCR products
per primer markedly depart from the ones computed for a randomly scrambled
database (probability density function). A large excess of particularly
efficient and particularly "poor" primers was observed in all simulations,
which confirms the notion that the proposed approach might help in selecting
particularly favorable 12-nt primer sequences for RNA fingerprinting. When
the significance of these findings is assessed by challenging the same
set of primers against the human and murine sequence databases, the numbers
of PCR products obtained in the two simulations correlate very well, indicating
that the unexpectedly high or low efficiencies of some primers do not arise
from aberrations in the composition of the databases used, but rather from
intrinsic differences in efficiency among primers. In other words, this
confirms that some "genetic words" have particularly high or low probabilities
of occurring in coding sequences (Claverie, Sauvaget, and Bougueleret,
1990), with no major differences between phylogenetically related genomes.
The predictivity of simulation in selecting efficient
primers appears to be confirmed by the analysis of the number of PCR products
experimentally obtained with a reduced panel of primers. The actual probability
of hybridization under the experimental conditions described was obviously
unknown, as were the exact sizes of the cDNA pools analyzed. The absolute
numbers of PCR products were lower than in the simulations; however, the
relative efficiencies of the tested primers were in reasonable agreement
with our predictions.
A series of criteria were adopted in selecting the
random-sequence primers to be tested by PCR simulation. These criteria
were aimed at excluding primers which would likely generate technical problems
(e.g. those containing homo-nucleotide stretches), at biasing the primers
towards coding regions (a fixed ratio of 8 C's or G's to 4 A's or T's was
used, and primers containing stop codons in the sense strand were excluded)
and at obtaining exhaustivity (at least four out of eight nt at the 3'
end were unique for each selected primer). The last constraint turned out
to be quite restrictive, in that after selecting about one hundred primers
many further random sequences had to be generated in order to find a new,
compatible one. Conceivably, this may lead to an enhanced coverage by our
primer panel.
As reported above, most of the PCR products cloned
so far using the primers in the panel contain significant ORFs, either
throughout their whole lengths, or at one end. This supports the idea that
a panel of primers selected as described here should make it possible to
address coding regions in mRNA in a majority of cases, permitting a prediction
as to the nature of corresponding peptide sequences, and the establishment
of cross-specific relationships with deposited sequences from distant phyla.
Although an increasing number of transcribed sequences are deposited in
nucleotide databases, catalogs are only complete for one model eukaryotic
organism, and a long time may elapse before full length cDNAs become available
for a significant number of organisms. Likewise, in the case of large genomic
sequences deposited in the framework of organism-specific genome sequencing
projects, the availability of a coding sequence tag would circumvent the
need for the lengthy and error-prone process of identifying and splicing
transcribed sequences at the computer. Thus, the prompt recognition of
a newly discovered sequence as a member of a phylogenetically conserved
gene family represents a significant advantage of our approach over previously
described ones. The results described here are more relevant when one considers
that, in its current version, our protocol utilizes oligo-dT-primed first
strand cDNA, thus shifting the cDNA pool towards 3' ends. An experimental
update in our approach will require first strand cDNA synthesis using internal
primers, rather than oligo-dT primers, to further enhance targeting of
coding sequences. To date, this has not been done lest a significant portion
of products might contain ribosomal RNA sequences, and is the current subject
of methodological work by our group.
An additional question to address was whether the
primers selected because of their high efficiency in yielding simulated
PCR products were directed towards subpopulations of genetic sequences.
Three criteria were considered: (i) the relation between the length of
the sequences and the number of products they yielded showed no sign of
clustering into subpopulations (not shown); (ii) the distributions of the
number of simulated PCR products per sequence never displayed multiple
modes and were generally smooth and continuous; (iii) although such distributions
were shifted towards high numbers of products (especially when obtained
with the sets of 96 best-performing primers) with respect to the expectations
for scrambled sequence databases (Appendix), they
were well fit by simply increasing the matching probability by a factor
equal to the ratio [observed / expected] mean numbers of products; the
latter approach also yielded adequate predictions of the percentage of
non-targeted transcripts ("silent sequences"). All this argues against
the existence of subpopulations of nt sequences with significantly different
probabilities of being recognized by the sets of primers employed here.
A more difficult problem to tackle is redundancy,
i.e. the production of many amplification products from each transcript
in the mRNA library used. A balance between redundancy and exhaustivity
must be reached empirically. In our simulations, the percentage of "silent
sequences" was closely approximated by the reciprocal of the mean number
of products from each sequence (a measure of redundancy). Our data suggests
that, as the number of products increases, the proportion of "silent sequences"
decreases more slowly than expected from Poisson statistics, where the
fraction of failures is predicted by exp(-mean). The departure from Poisson
behavior, observed in the simulations, is predicted theoretically, based
on the heterogeneous probability of being sampled for sequences with dissimilar
length and composition. An experiment employing 96 primers with some 100
bands per primer would yield about 10,000 discernible PCR products; assuming
that a typical cell expresses some 20,000 genes, this would correspond
to an average hitting rate of 0.5 PCR products per expressed gene. According
to our theoretical predictions and simulations, under this conditions coverage
should approximate 13% (as opposed to the theoretical upper limit of
39% for a purely random, Poisson distribution). Thus, the method here proposed
is certainly not aimed at obtaining exhaustive coverage of differential
gene expression. Much higher numbers of primers (and PCR products) would
be needed; for example, in order to fish out 90 % of the 20,000 expressed
genes one should analyze about 200,000 bands. Classical differential display
with similar numbers of PCR products should obtain similar coverage rates,
since available data suggest that the probability of yielding PCR products
by differential display is also markedly heterogeneous (genes expressed
in high number of copies have much higher probability of yielding PCR products;
Bertioli et al., 1995; our unpublished data). Thus, the main differences
should not regard coverage, but bias at low coverage levels: whereas differential
display tends to produce PCR products for more abundantly expressed genes,
the approach here proposed appears not to be biased in this regard and
to produce a high percentage of PCR products in coding regions.
An approach similar to ours has been taken by others
(Lopez-Nieto and Nigam, 1996). Those authors proposed and described a protocol
employing each one of 30 computer-generated arbitrary 8-nt primers selected
for their probability of occurrence in sense strands of coding sequences,
to be used in combination with each of the reverse complement series, i.e.
29 primers. In the present paper, we propose the utilization of single,
partially degenerate primers selected for their frequent and balanced appearance
both in sense and antisense strands. The protocol proposed by Lopez-Nieto
and Nigam entails the use of 30 ´ 29 = 870 PCR amplifications, as
opposed to 96 in our schema. Although 870 primer combinations will provide
greater coverage of the genes expressed in a given tissue sample than just
96 PCRs, from our analysis of the relationship between exhaustivity and
redundancy, one would suspect that the gain may not be worth the effort
(2-3 times as many expectedly targeted genes). More in general, we believe
that one should probably not embark on a PCR-based differential screening
project with the goal in mind of producing a complete catalog of differentially
expressed genes; instead, a more sensible scope would be to generate a
number of genetic tags helpful in initiating the dissection of functional
pathways in development or differentiation active in one's system of choice.
As a matter of fact, these pathways typically involve, in addition to differentially
expressed genes, ubiquitously expressed genes as well as post-transcriptional
and post-translational regulatory events. Other valuable, albeit more demanding
approaches are available to those researchers who wish to generate complete
catalogs, rather than obtaining a sample of differential gene expression
in their biological systems (Kato, 1995). More importantly, microchip-based
technology will become more generally available in the medium term for
high-throughput, genome science-style studies in many organisms.
At difference with Lopez-Nieto and Nigams study
(1996), which described computer analysis for a large set of random primers,
but focused on the experimental validation of a primer set specifically
designed to target a group of G protein-coupled receptor genes, the present
study has identified primers not biased towards any specific gene family,
which have been utilized experimentally by a number of groups to target
protein coding regions in general, and all appear to work equally efficiently
in the standard experimental conditions described in the present paper
(Corradi et al., 1996; Cabibbo et al., 1998; Malgaretti et al., 1997).
Furthermore, the octamers need 5' adaptors to increase product numbers
and high annealing temperatures (54 °C) to decrease the background
of low-efficiency/truncated amplification products (Lopez-Nieto and Nigam
1996). However, this procedure might somewhat favor the recursive amplification
of sequences partially or completely homologous to the adaptor. Our protocol
employs longer primers, at a lower annealing temperature (50 °C), resulting
in good control of the background level, and high amplification efficiencies.
The evidence presented here demonstrates that, in
our scheme, only four residues at the 3' end of our primers need to anneal
with a perfect match to their templates for the polymerase chain reaction
to take place, while up to four mismatches are well tolerated over the
remaining eight residues. Thus, 12-mer primers such as the ones proposed
in the present paper produce large numbers of products in our experimental
conditions by virtue of partially degenerate annealing. Furthermore, as
primer sequences used in experiments are identical to those used in simulations
(no adaptors), effective lessons on how to refine the simulation strategy
can be learned from the analysis of experimental results.
In summary, the present approach, by combining the predictive
power of computer-based database analysis with the establishment of robust,
repeatable experimental conditions, proposes PCR-based RNA fingerprinting
as a rejuvenated, efficient approach to the analysis of differential gene
expression.
ACKNOWLEDGEMENTS
We thank Carol L. Stayton and Nicoletta Malgaretti for their essential
contribution to the described protocols. This methodological work was made
possible by grants from the Italian Telethon (B14) and the Associazione
Italiana Sclerosi Multipla (AISM) to GGC and CNR target project on biotechnology
to AC.
REFERENCES
Altschul, S., Gish, W., Miller, W., Myers, E., and Lipman, D. (1990). Basic Local Alignment Search Tool. J. Mol. Biol. 215: 403-415.
Ausubel, F. M., Brent, R., Kingstone, R. E., Moore, D. D., Smith, J. A., and Struhl, K. (1995). "Current Protocols in Molecular Biology".
Bauer, D., Muller, H., Reich, J., Riedel, H., Ahrenkiel, V., Warthoe, P., and Strauss, M. (1993). Identification of differentially expressed mRNA species by an improved display technique (DDRT-PCR). Nucleic Acids Research 21: 4272-4280.
Bertioli, D. J., Schlichter, U. H., Adams, M. J., Burrows, P. R., Steinbiss, H. H., and Antoniw, J. F. (1995). An analysis of differential display shows a strong bias towards high copy number mRNAs. Nucleic Acids Research 23: 4520-3.
Cabibbo, A., Consalez, G. G., Sardella, M., Sitia, R., and Rubartelli, A. (1998). Changes in gene expression during growth arrest of HepG2 hepatoma cells induced by reducing agents or TGFbeta1. Oncogene 16: 2935-2944.
Claverie, J. M., Sauvaget, I., and Bougueleret, L. (1990). K-tuple frequency analysis: from intron/exon discrimination to T-cell epitope mapping. Methods in Enzymology 183: 237-52.
Consalez, G. G., Corradi, A., Ciarmatori, S., Bossolasco, M., Malgaretti, N., and Stayton, C. L. (1996). A new method to screen clones from differential display experiments prior to RNA studies. Trends in Genetics 12: 455-456.
Corradi, A., Croci, L., Stayton, C., Gulisano, M., Boncinelli, E., and Consalez, G. G. (1996). cDNA sequence, map and expression of the murine homolog of GTBP, a DNA mismatch repair gene. Genomics 36: 288-295.
Covini, N., Tamburin, M., Consalez, G., Salvati, P., and Benatti, L. (in press). Induction of ZFM1/SF1 mRNAin rat and gerbil brain after global ischemia.
Devereux, J., Haeberli, P., and Smithies, O. (1984). A comprehensive set of sequence analysis programs for the VAX. Nucleic Acids Research 12: 387-395.
Diatchenko, L., Lau, Y.F., Campbell, A.P., Chenchik, A., Moqadam, F., Huang, B., Lukyanov, S., Lukyanov, K., Gurskaya, N., Sverdlov, E.D. and Siebert, P.D (1996). Suppression subtractive hybridization: a method for generating differentially regulated or tissue-specific cDNA probes and libraries. Proceedings of the National Academy of Sciences of the U.S.A. 93: 6025-30.
Dragoni, I., Mariotti, M., Consalez, G. G., Soria, M. R., and Maier, A. M. (in press). EDF-1, a novel gene product involved in human endothelial cell differentiation. J. Biol. Chem. .
Fargnoli, J., Holbrook, N. J., and Fornace, A. J., Jr. (1990). Low-ratio hybridization subtraction. Analytical Biochemistry 187: 364-73.
Guttinger, M., Sutti, F., Panigada, M., Porcellini, S., Merati, B., Mariani, M., Teesalu, T., Consalez, G. G., and Grassi, F. (1998). EVA, a novel member of the immunoglobulin superfamily expressed in embryonic epithelia with a potential role as homotypic adhesion molecule in thymus histogenesis. Journal of Cell Biology 141: 1061-1071.
Hadman, M., Adam, B. L., Wright, G. L., Jr., and Bos, T. J. (1995). Modifications to the differential display technique reduce background and increase sensitivity. Analytical Biochemistry 226: 383-6.
Kato, K. (1995). Description of the entire mRNA population by a 3' end
cDNA fragment generated by class IIS restriction enzymes. Nucleic Acids
Research 23: 3685-90.
Liang, P. (1994). Differential display using one-base anchored oligo-dT
primers. Nucleic Acids Research 22: 5763-5764.
Liang, P., and Pardee, A. (1992). Differential display of eukaryotic messenger RNA by means of the polymerase chain reaction. Science 257: 967-971.
Liang, P., and Pardee, A. B. (1995). Recent advances in differential display. Current Opinion in Immunology 7: 274-80.
Lopez-Nieto, C., and Nigam, S. (1996). Selective amplification of protein-coding regions of large sets of genes using statistically designed primer sets. Nature Biotechnology 14: 857-861.
Malgaretti, N., Pozzoli, O., Bosetti, A., Corradi, A., Ciarmatori, S., Bianchi, M., Martinez, S., and Consalez, G. G. (1997). Mmot1, a new helix-loop-helix transcription factor gene displaying a sharp antero-posterior expression boundary in the embryonic mouse brain. J. Biol. Chem 272: 17632-17639.
Mariani, M., Corradi, A., Baldessari, D., Pozzoli, O., Fesce, R., Martinez, S., Boncinelli, E., and Consalez, G. G. (in press). Mab21, the mouse homolog of a C. elegans homeotic regulator, participates in cerebellar, midbrain and eye development. .
Pearson, W. R. (1994). Using the FASTA program to search protein and DNA sequence databases. Methods in Molecular Biology 25: 365-389.
Roberts, L. (1991). GRAIL seeks out genes buried in DNA sequence [news]. Science 254: 805.
Rohrwild, M., Alpan, R. S., Liang, P., and Pardee, A. B. (1995). Inosine-containing primers for mRNA differential display. Trends in Genetics 11: 300.
Rossetti, G., Impagnatiello, M. A., Orecchia, S., Bianchi, E., Croci,
L., Consalez, G. G., and Pardi, R. (in preparation). HARP-1, a relative
of Brainiac, encodes a novel intercellular contact-regulated protein and
is preferentially expressed in tissues of ectodermal origin. .
Sambrook, J., Fritsch, E. F., and Maniatis, T. (1989). "Molecular Cloning:
A Laboratory Manual". Cold Spring Harbor Press, Cold Spring Harbor.
Tokuyama, Y., and Takeda, J. (1995). Use of 33P-labeled primer increases
the sensitivity and specificity of mRNA differential display. Biotechniques
18: 424-5.
Velculescu, V.E., Zhang, L., Vogelstein, B., and Kinzler, K.W. (1995).
Serial analysis of gene expression. Science 270: 484-487.
Welsh, J., Chada, K., Dalal, S., Cheng, R., Ralph, D., and McClelland, M. (1992). Arbitrarily primed PCR fingerprinting of RNA. Nucleic Acids Res. 20: 4965-4970.
Zhao, S., Ooi, S. L., and Pardee, A. B. (1995). New primer strategy
improves precision of differential display. Biotechniques 18: 842-6, 848,
850.
Computation of Efficiency Index (E.I.) and Selectivity Index (S.I.).
A modal value was computed from smooth lines fit to histograms of number of simulated PCR products per primer (see, e.g. red lines in figures 1A and 2A). The efficiency index, E.I., for each primer was computed as the decimal logarithm of the ratio:
Computation of the expected distribution of PCR products per primer
Let the databank, D, be a set of N
sequences, ![]() .
Given that Ss is a sequence composed of as
C/G nucleotides and bs A/T nucleotides, the probability
of a G or C nucleotide in the primer matching an arbitrary nucleotide in
the sequence is
.
Given that Ss is a sequence composed of as
C/G nucleotides and bs A/T nucleotides, the probability
of a G or C nucleotide in the primer matching an arbitrary nucleotide in
the sequence is ![]() ,
and the corresponding probability for A or T is
,
and the corresponding probability for A or T is ![]() .
.
In order to obtain hybridization a certain degree
of matching must be obtained; here we arbitrarily decided that hybridization
would occur for at least 9 matching bases out of 12, with no mismatches
within the last 4 bases at the 3' end. Under these conditions, the probability
of hybridization for a given template sequence and a given primer is a
function of the fraction of C/G nucleotides in the sequence, ![]() ,
the number of C/G in the first 8 bases of the primer, n1,
and the number of C/G in the last 4 bases at the 3' end, n2.
,
the number of C/G in the first 8 bases of the primer, n1,
and the number of C/G in the last 4 bases at the 3' end, n2.
For any specific alignment of the primer on the template
Ss, we have:
so that the probability of hybridization for any specific alignment of the primer on the template is Ps = As x Bs. The average value of Fs was 0.53 (* 0.082) and in general Ps was about 1-2x10⁻⁴, its value increasing for primers with increasing numbers of C/G nucleotides in the last 4 positions.
Assuming that PCR products of interest would have a length, L, comprized between L0 = 100 and L1 = 1000 BP, then the number of combinations of two acceptable positions on a template sequence Ss, of length Ms is:
This gives rise to a binomial distribution of the
number of PCR products obtained from template sequence Ss
of length Ms and a primer with given values of n1
and n2. Such distribution is defined by the binomial
parameters ![]() and n = Cs; the corresponding probability density
function (p.d.f.) is:
and n = Cs; the corresponding probability density
function (p.d.f.) is: ![]() .
.
Actually, to estimate the probability of obtaining
simulated PCR products (neglecting the technical aspects connected to experimentally
obtaining a PCR amplification product), the unwanted possibility of a further
hybridization in between the two valid positions must be excluded. For
a product of length L, this possibility has an approximate probability
of ![]() ,
and therefore about 900 x Ps for the average product
length of 450 BP. For the usual magnitude of Ps this
factor amounts to about 10-2 and can be neglected.
,
and therefore about 900 x Ps for the average product
length of 450 BP. For the usual magnitude of Ps this
factor amounts to about 10-2 and can be neglected.
The distributions of PCR products from the N sequences in the
database ![]() are expected to be independent. Therefore, the corresponding characteristic
functions (ch.f.) can be computed
are expected to be independent. Therefore, the corresponding characteristic
functions (ch.f.) can be computed ![]() and the ch.f. for the whole databank will simply be:
and the ch.f. for the whole databank will simply be:  .
.
From jD(u) the expected p.d.f. of the number of PCR products from the whole databank, pD(x), is computed for each primer. Averaging over the set of primers yields the expected distribution of the number of PCR products per primer (P1). Notice that pD(x) is necessarily equal for primers having the same values of n1, n2 and Ps. Thus, P1 may be multimodal (up to 5 peaks for n2 = 0 to 4).
The same procedure is used to compute the expected p.d.f. of the number of PCR products from each sequence, P2 (in this case the ch.f. is computed by summing the logs of the single ch.f.'s over the set of primers for the same sequence).
A third distribution of interest is that of the number
of "successful" primers per sequence (i.e. yielding at least one PCR product
from the sequence), P3. This is computed
in the same way using the modified p.d.f., ps,
such that:  .
.
Distribution P1 is used
to check whether the observed distribution of PCR products per primer significantly
departs from the expectation: if a marked excess of particularly "good"
and "poor" primers are found, this argues against a purely random distribution
of nucleotides in the sequences of the databank.
Distributions P2 and P3
yield information on the exhaustivity of the approach, i.e. the capability
of picking out as many different sequences as possible. In particular,
the shape of the p.d.f. P3 can be compared to
the corresponding distribution, obtained by the simulation experiments,
to check whether any bias is present towards a subpopulation of sequences
(i.e. whether some sequences are significantly more subject to amplification
than others).
This approach cannot be straightforwardly applied to the distributions obtained using sets of particularly efficient primers. These distributions are obviously shifted to the right, with respect to the p.d.f. P3, which is computed based on a purely random nucleotide composition of the databank. The size of the shift is conveniently represented by the ratio of the mean values. If the shift simply reflects an increased hybridization probability with no bias towards sequence subpopulations, the shape of the curve will be easily reproduced by computing the logarithm of the characteristic function of the expected probability, multiplying it by the ratio of the means and computing the resulting probability distribution (this is performed by applying the direct and inverse fast Fourier transforms). A reasonable agreement with the observed distribution will argue against biases in favor of specific sequence subpopulations.
FIGURE LEGENDS
Figure 1. (A) Histogram of the number of simulated CDS-containing PCR products per primer (503 primers tested on a human nonredundant cDNA database). Also shown is the expected distribution of product numbers per primer against a randomly scrambled sequence database (blue line). Notice the large excess of poorly efficient and highly efficient primers. (B) Scatter plot of the number of simulated PCR products in CDS, yielded by each primer when tested on the human (x-axis) or mouse (y-axis) cDNA databases. (C) Analysis of exhaustivity and redundancy on the results of simulated PCR (96 "best" primers - see text - tested on a human nonredundant cDNA database). Shown is the distribution of the number of simulated PCR products per transcript. The solid line represents the distribution of product numbers per transcript expected against a randomly scrambled sequence database. The dashed line represents the distribution expected after increasing the theoretical probability of matching by a factor equal to the ratio of observed to expected mean product numbers per transcript.
Figure 2. Efficiency and selectivity of pairs of dodecanucleotide primers containing a partially degenerate nucleotide at the 3' end (W or S), tested against a human nonredundant cDNA database. (A) histogram of the number of simulated PCR products per primer pair (solid line: 522 primer pairs; dashed line: 96 best pairs). (B) scatter plot of the selectivity index (SI) versus the efficiency Index (EI). See text and appendix for the meaning and computation of the two indices. The area enclosed in the square corresponds to EI's between 0.3 and 1.18 (i.e. 2 to 15 times the modal number of products) and SI's above 1.4. Primer pairs falling in this range were included in the optimal primer set, and ordered according to their SI's. The resulting primer set is reported in table 1. (C) distribution of the number of different degenerate primers yielding simulated PCR products from each transcript. Solid and dashed lines are the expected distributions before and after correcting the theoretical probability of matching as in figure 1C.
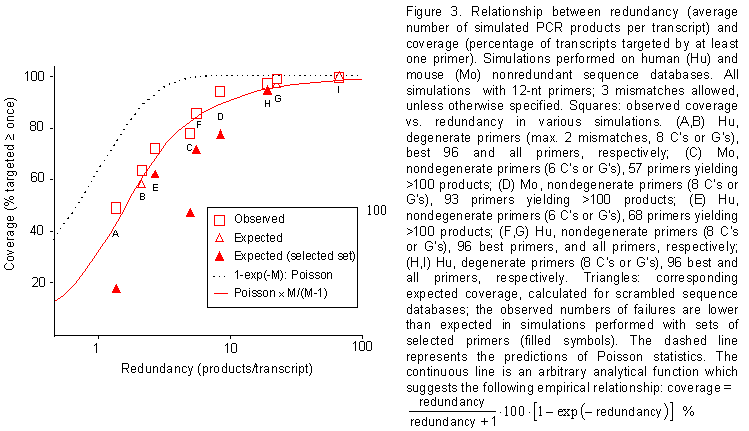
Figure 3. Relationship between redundancy (average number of simulated PCR products per transcript) and coverage (percentage of transcripts targeted by at least one primer). Simulations performed on human (Hu) and mouse (Mo) nonredundant sequence databases. All simulations with 12-nt primers; 3 mismatches allowed, unless otherwise specified. Squares: observed coverage vs. redundancy in various simulations. (A,B) Hu, degenerate primers (max. 2 mismatches, 8 C's or G's), best 96 and all primers, respectively; (C) Mo, nondegenerate primers (6 C's or G's), 57 primers yielding >100 products; (D) Mo, nondegenerate primers (8 C's or G's), 93 primers yielding >100 products; (E) Hu, nondegenerate primers (6 C's or G's), 68 primers yielding >100 products; (F,G) Hu, nondegenerate primers (8 C's or G's), 96 best primers, and all primers, respectively; (H,I) Hu, degenerate primers (8 C's or G's), 96 best and all primers, respectively. Triangles: corresponding expected coverage, calculated for scrambled sequence databases; the observed numbers of failures are lower than expected in simulations performed with sets of selected primers (filled symbols). The dashed line represents the predictions of Poisson statistics. The continuous line is an arbitrary analytical function which suggests the following empirical relationship: coverage = 100 ´ (redundancy 0.5) / (redundancy + 0.5) %.
Figure 4. (A) Diagram illustrating the mode of annealing of twelve-mer primers to known sequences deposited in nucleotide databases (GenBank, DBEST). Shown, is the percentage of perfect matches, as opposed to degenerate annealing, observed in 29 cases employing 8 different primers. y axis: percentages of nondegenerate annealing measured at each residue of the 29 primers analyzed. (B) Correlation between product numbers predicted by simulations and numbers of bands observed in RNA fingerprinting experiments performed with the corresponding primers. Simulations were performed on mouse nonredundant cDNA database, using 12-nt primers (8 C-G, 4 A-T), degenerate and nondegenerate. Thirteen primers were arbitrarily chosen among those yielding low, medium and high numbers of simulated PCR products; PCR experiments were performed as described in the Methods section, and only clearly discernible bands were recorded. Examples of RNA fingerprinting gels obtained with our method are published elsewhere (Malgaretti et al., 1997; Cabibbo et al., 1998)
TABLE LEGENDS
Table 1- 96 primers selected for their high efficiency in yielding large number of PCR products, expressed as efficiency index (E.I.), and for their selectivity for coding regions versus untranslated regions of transcripts, expressed as selectivity index (S.I.). See text and Appendix for the significance and computation of the two indices.
Table 2 - Transcript sizes (kb) and
coding sequence (CDS) sizes (bp) of cDNAs deposited into the Genbank database,
identified by PCR-based differential screening using our computer-assisted
gene fishing approach.